Engagement & Retention project | Rapido
Before we begin, lets know What's Rapido?
Understanding via User Persona
Meet Riya Agarwal, a Mumbai millennial stuck in post monsoon traffic, late for her gig. While others honk helplessly, she grins - taps Rapido.
In 90 seconds, Captain Arjun zooms in on his neon-green bike , dodging gridlock like a pro.
YAY! Riya arrives 20 mins early, hair windswept but victorious.
"Why Ola-uber? Rapido’s faster, cheaper, and cooler! "
Founded in 2015, Rapido is India's top low-cost mobility platform, transforming urban travel. It has grown quickly to service more than 100 cities in 24 Indian states.
Why Rapido rules the roads:
- Bike-first rebels: Born as India's first bike-taxi pioneers (56% market dominance) , they turn traffic jams into joyrides.
- Captain's paradise: Subscription model lets drivers earn 15% more than Uber/Ola while makes the rides cheaper for you.
- Zero-drama rides: "Auto Plus" guarantees no cancellations (unlike those apps that ghost)
- Tier-2 titans: Masters of cities Ola/Uber ignore, with hyper-local hacks like
- Itanagar, Arunachal Pradesh
- Aizawl, Mizoram
- Dimapur, Nagaland
- Agartala, Tripura
- Shillong, Meghalaya and many more.
- Also includes: They’ve now got cabs, autos, rental services as well as delivery services as well
What's the core value proposition of Rapido and how users experiences it?
Whether it's a daily commute, last-mile connectivity, or quick errands, Rapido offers a budget-friendly and convenient alternative to cabs and autos as well. It connects users with verified captains making urban mobility hassle free.
Users experience core value prop through:
- Cuts travel time by up to 50% in congested cities.
- Lowest-cost rides making it affordable for any user i.e., with a base fare of ₹15 + ₹3/km
- Verified Captains with features making it more reliable with real-time tracking and sos options
- Multi-vehicle options (bikes, autos, cabs) for different needs giving user flexibility to choose as per the needs.
Current Edge making it different from others:
- Operational profitability without discounts
- No surging price unlike others.
- Last-mile connectivity in tier-2 cities where competitors don't operate
- Subscription model for drivers enabling 15% higher earnings
Current Limitations:
- City specific availability
- No intercity travel thus making it limited to within the same city.
Rapido – Skip the Jam, Ride Like a Champ!
What is the natural frequency of Rapido?
Ideal Customer Profile
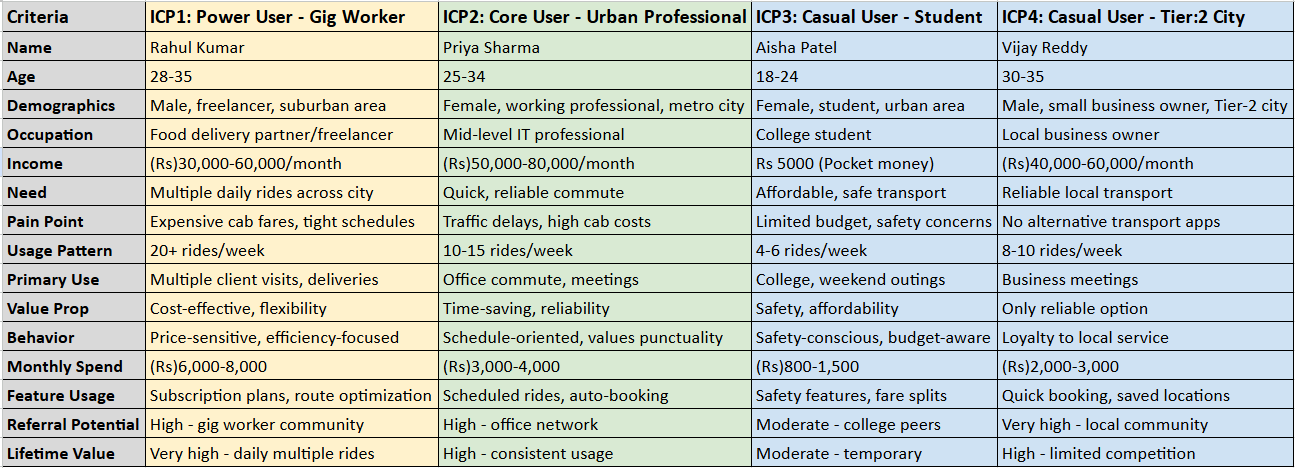
- Power User: ICP1 (Gig Worker): Multiple daily rides (20+ per week) due to delivery/freelance work nature, heaviest user with consistent usage throughout the day
- Core User: ICP2 (Urban Professional): Twice daily during weekdays (10-15 rides/week) primarily during peak office hours for commute and meetings
- Casual User: ICP3 (Student) & ICP4 (Tier-2 Business Owner): (4-10 rides/week)
- ICP3 (Student): Sporadic usage (4-6 rides/week) concentrated around college timings and weekend social activities
- ICP4 (Tier-2 Business Owner): Regular but moderate usage (8-10 rides/week) primarily during business hours for local meetings and market visits.
What is the best engagement framework for Rapido?
For Rapido, the Frequency-based engagement framework is the best fit, as the core value of Rapido lies in providing quick, affordable, and reliable transportation for daily commutes and errands. Below model explains well:
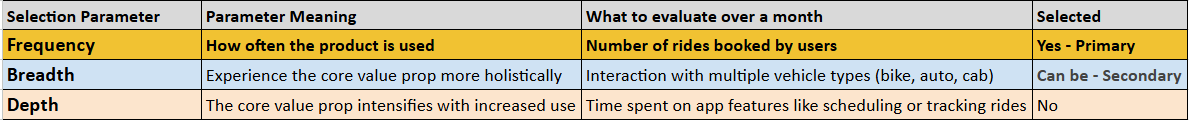
Arriving at the Best Engagement Framework
✅Frequency
- Rapido thrives on repeated usage for daily commutes, errands, or gig work. Measuring how often users book rides directly reflects engagement with its core utility.
- High-frequency users, such as gig workers or office commuters, are the backbone of Rapido's revenue and retention strategy. Encouraging frequent usage ensures consistent engagement and loyalty.
Why Frequency Works Best for Rapido
- Core Value Alignment: The primary promise of Rapido is convenience and affordability for frequent commutes. Tracking frequency directly ties to this core offering.
- Revenue Dependency: Frequent rides drive revenue more than occasional deep exploration of app features.
- User Behavior: Most users return to Rapido for quick trips rather than prolonged app interaction.
❌Depth
- While depth (e.g., time spent exploring features) can indicate user interest, it’s less relevant for Rapido. Users prioritize speed and efficiency over spending extended time in the app.
- Unlike apps like Duolingo or Netflix, where deeper engagement enhances value, Rapido’s value lies in swift transactions.
🤔Breadth
- Breadth plays a secondary role by encouraging users to explore multiple services (bikes, autos, cabs). For example, a bike user might switch to an auto during bad weather or use a cab for longer distances.
- Promoting breadth ensures that users see Rapido as a one-stop solution for all their transport needs.
Why Not the Depth and Breadth?
- Depth: Spending more time in the app doesn’t equate to better engagement; it might even signal friction in the user experience.
- Breadth as Primary: While breadth is valuable for cross-selling services, it doesn’t capture the essence of Rapido’s primary use case—frequent daily rides.
By focusing on frequency as the primary metric and breadth as a secondary measure, Rapido can optimize its engagement strategy to cater to its high-frequency user base while encouraging broader adoption of its services.
Now Lets define Active user of Rapido?
Actions That Make Someone an Active User of Rapido
1. Books at least 3 rides within the first 10 days - Power User/Core User
2. Uses Rapido for daily commutes for 5+ days a week - Core User
3. Refers a friend and completes a ride using referral benefits within 15 days - Core User
4. Books rides across multiple vehicle types (bike, auto, cab) within the first 15 days - Power User
5. Takes at least one ride per week consistently for a month - Casual User
Natural Frequency of Active Users as per User Segments:
- Casual User: 1-2 rides per week
- Core User: Daily rides (5-7 times a week)
- Power User: Multiple rides per day (10+ rides a week)
Active users of Rapido are those who frequently engage with its core value proposition of affordable, quick, and reliable transportation, with varying levels of intensity based on their commuting needs and habits.
Lets define Ideal Customer Profile as per multiple User Segments
Using the same one as described earlier :)
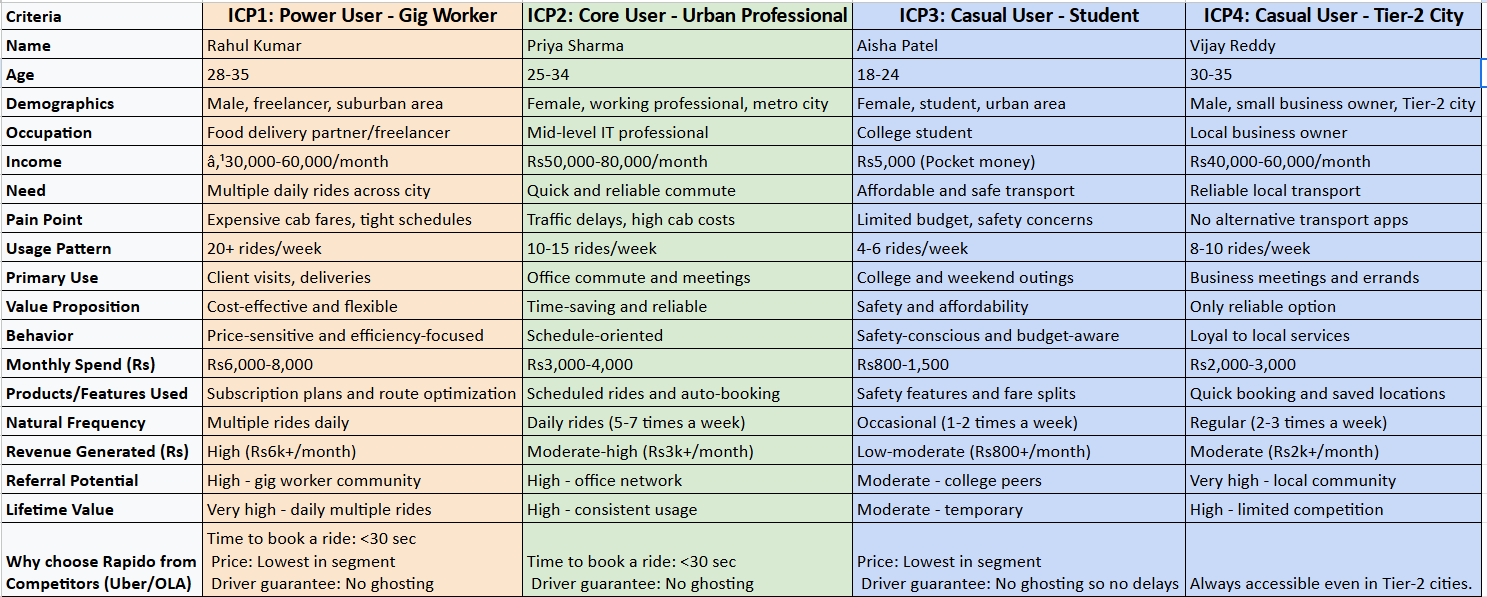
Key Features Valued by Each User Segment:
- ICP1: Power User - Gig Worker
- Values subscription plans for predictable costs.
- Prioritizes route optimization for efficiency.
- Relies on guaranteed availability to meet tight schedules.
- ICP2: Core User - Urban Professional
- Prefers scheduled rides to save time during peak hours.
- Appreciates reliability with no last-minute cancellations.
- Avoids price surges during high demand.
- ICP3: Casual User - Student
- Focuses on affordability with no hidden charges.
- Values safety features like GPS tracking.
- Occasionally uses fare-splitting for group outings.
- ICP4: Casual User - Tier-2 City
- Seeks reliability as Rapido is often the only app available.
- Appreciates quick booking and saved locations for repeat trips.
- Avoids surge pricing during local events or high demand.
Lets also define Usage Based segmentation
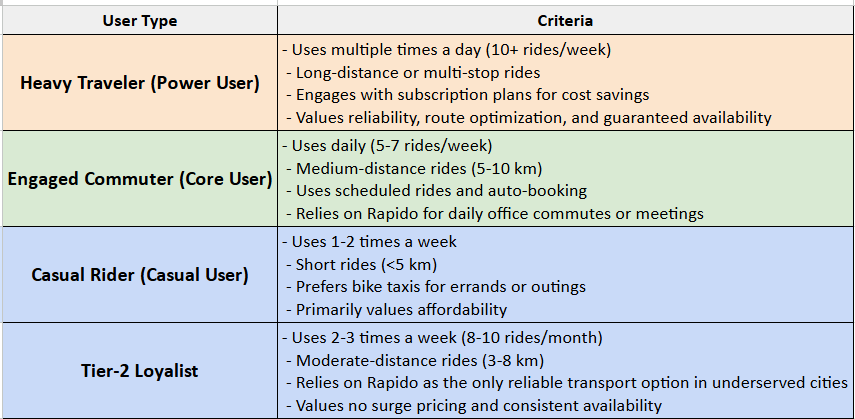
Key Insights on usage based segmentation :
- Heavy Travelers: Power users who maximize Rapido’s features like subscriptions and multi-stop routes to meet their frequent travel needs.
- Engaged Commuters: Depend on Rapido as their primary mode of transport for daily commuting needs.
- Casual Riders: Use Rapido occasionally for convenience, focusing on affordability for short, infrequent trips.
- Tier-2 Loyalists: Unique to smaller cities, they choose Rapido due to limited alternatives and value its reliability over competitors.
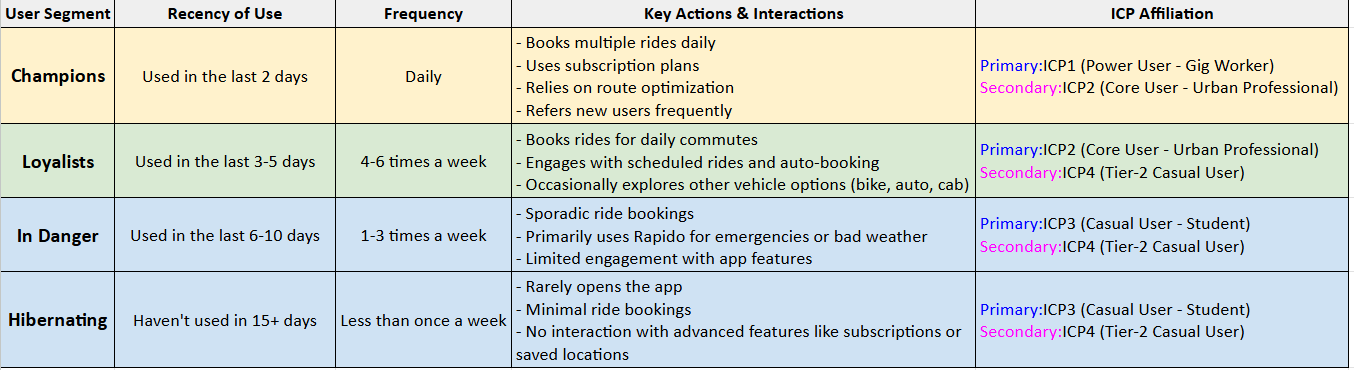
Advanced segmentation: Loyalists/Champions/In danger/Hibernating
Well those seems to be some fancy terms, lets see here in Rapido case, how can we define it:
Explanation of Advance Segments:
- Champions
- These are Rapido's most engaged users, like gig workers and frequent commuters, who rely on the platform daily.
- They maximize features like subscriptions and route optimization, ensuring high lifetime value.
- Loyalists
- Loyalists use Rapido regularly for their daily or weekly commutes but may not engage with advanced features as much as Champions.
- They are consistent users who value reliability and affordability.
- In Danger
- These users have reduced their engagement and only use Rapido occasionally, often during emergencies or specific needs like bad weather.
- They are at risk of churn if not re-engaged effectively.
- Hibernating
- Hibernating users have minimal interaction with the app and may have shifted to competitors or stopped needing the service.
- They require targeted campaigns to revive interest, such as discounts or feature highlights.
Well from above all context, we can say -
Champions and Loyalists drive frequent usage and revenue, while Casual and Tier-2 users need re-engagement strategies to boost retention and usage frequency.
Figure out the retention data for your product. If you don't have access to the same, begin by adjusting the industry standards. Plot down the data and bring to life your retention curve. Draw out observations and insights from the same.
What is causing your users to churn?
Go back to your user insights and figure out the number one reason of churn by listing down all the factors.
Understanding Retention for Rapido user
Bird's Eye View : Current retention rate in terms of User & at what time period retention curve flatten
Since I don’t have direct access to Rapido’s retention data, I’ll use industry benchmarks for ride-hailing and mobility services to estimate a realistic retention curve.
Industry standards for mobility apps suggest the following average retention rates:
•Day 0 (Sign-up/First Ride) → 100% (All users)
•Day 1 → ~35-40%
•Day 7 → ~25-30%
•Day 30 → ~15-20%
•Day 60 → ~10-12%
•Day 90 → ~8-10% (Where the curve flattens)
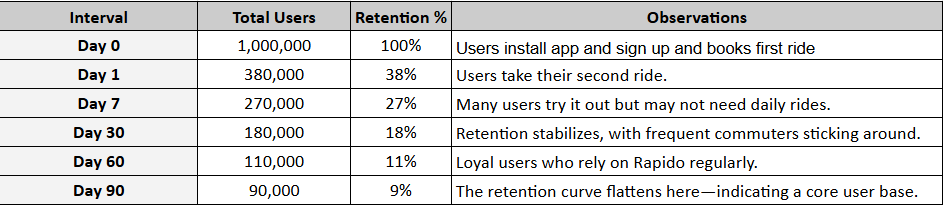
Estimated Retention Data for Rapido
Let’s assume 1,000,000 users sign up (Day 0) for this analysis. Here's how retention might look:
Lets take a look at the retention curve achieved:
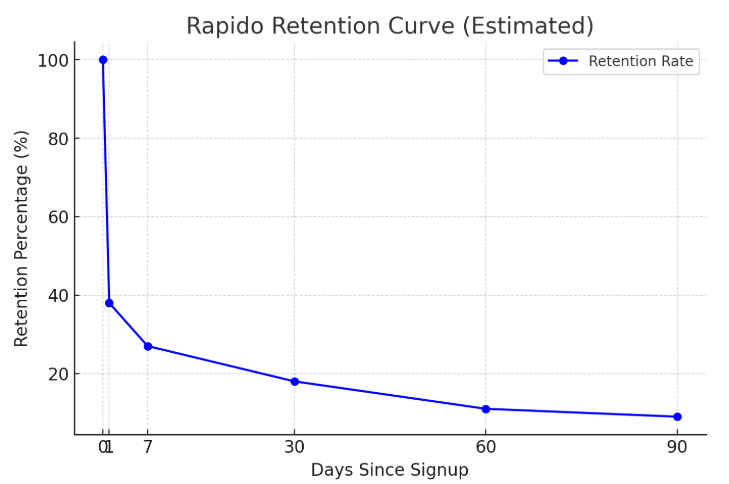
Retention Analysis & Insights from the above data
- Steep Drop in First Few Days
- Day 1 retention is 38%, meaning 62% of users don’t return after their first ride.
- This is a critical drop-off point, indicating the need for better onboarding, incentives, or first-ride experiences.
- Gradual Decline Over Time
- By Day 7, retention is 27%, showing that users are still churning but at a slower rate.
- Day 30 sees an 18% retention rate, meaning a core user base is forming i.e., with a slower decline thereafter.
- Retention Curve Flattens Around Day 60-90
- By Day 60, retention is ~11%, and by Day 90, it reaches ~9%, suggesting that the most loyal and habitual users remain.
- This is where the retention curve stabilizes, meaning users who stay beyond Day 90 are likely long-term riders and represent Rapido's core and power user segments (e.g., gig workers and daily commuters) who have integrated Rapido into their routines.
- Retention Challenges:
- The steep drop-off between D0 and D7 indicates a need to improve early user engagement strategies, such as better onboarding, incentives for repeat rides, or highlighting key features like affordability and reliability.
After having insights i.e., seeing challenges, lets see what can be done retain users
- Early Engagement Focus: Address high D0-D7 churn by improving onboarding experiences and offering ride discounts or loyalty rewards to encourage repeat usage.
- Core User Retention: The flattening of the curve after Day 30 shows that core and power users find sustainable value in the app. Focus on retaining these segments with personalized offers and subscription plans.
- Reactivation Opportunities: For inactive users, targeted re-engagement campaigns (e.g., push notifications or emails) can help boost retention rates further.
By addressing early drop-offs and doubling down on re-engagement strategies, Rapido can improve its overall retention rates and user lifetime value.
Microscopic view: What channels drive the best retention & What sub features/ sub products drive the best retention
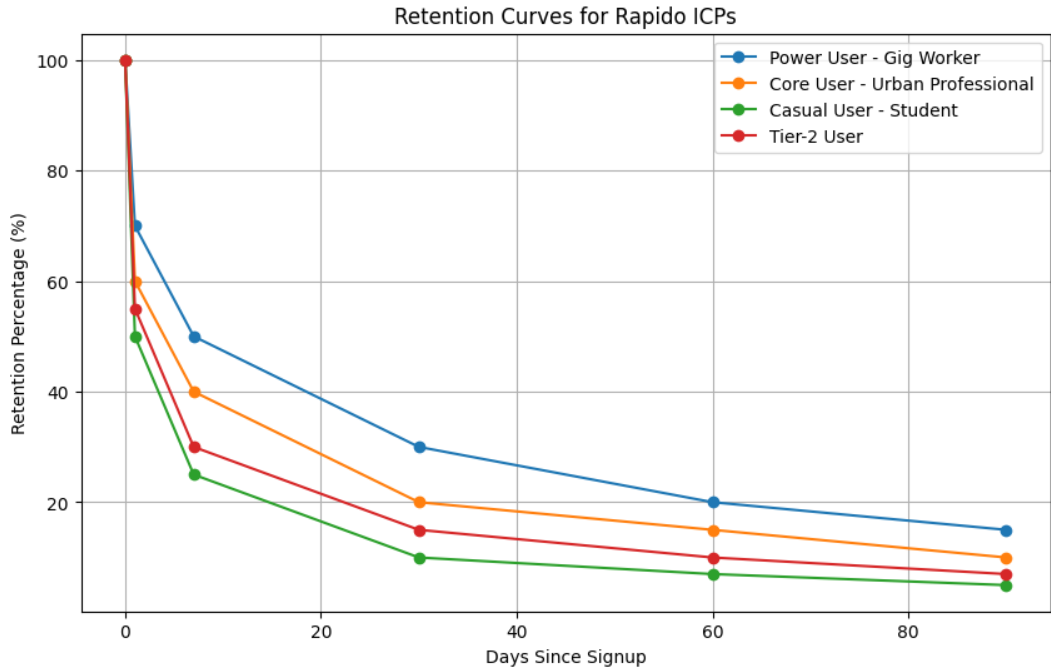
1) Which ICP Drives the Best Retention?
Answer:
The Power User - Gig Worker (ICP1) drives the best retention for Rapido.
Why It Is Chosen?
- As seen in the segmented retention curve, Power Users have the highest retention rates across all intervals (D7, D30, D60, and D90).
- These users rely on Rapido for frequent daily rides (20+ rides/week), making it an integral part of their work routine.
- Features like subscription plans, route optimization, and guaranteed availability align perfectly with their needs, ensuring consistent engagement.
Why Others Are Not Chosen?
- Core Users - Urban Professionals (ICP2): While they show moderate retention, their usage frequency (5-7 rides/week) is lower than Power Users, leading to slightly lower long-term retention.
- Casual Users - Students (ICP3): Their sporadic usage (1-2 rides/week) results in higher drop-off rates by Day 30. They are less likely to form a habit of using Rapido regularly.
- Tier-2 Users (ICP4): Though they show better retention than Casual Users due to limited competition in their regions, their usage frequency and spend are still lower than Power Users.
2) Which Acquisition Channels Drive the Best Retention?
Answer:
The Gig Worker(Power user) Community Referrals drive the best retention for Rapido.
Why It Is Chosen:
- Gig workers actively refer Rapido to peers in their network, ensuring that new users are already aligned with the app's core value proposition of affordability and reliability.
- These users tend to have similar needs (frequent daily rides) and naturally integrate Rapido into their workflows, leading to high retention rates.
Why Others Are Not Chosen:
- Digital Ads for Urban Professionals: While effective for acquiring Core Users, this channel does not guarantee high retention as professionals may switch between apps depending on pricing or availability.
- Student Discounts: These attract Casual Users but fail to retain them long-term due to their irregular usage patterns.
- Local Promotions in Tier-2 Cities: While effective in acquiring Tier-2 Loyalists, retention is limited by lower ride frequency compared to Power Users.
3) What Sub-Feature or Sub-Product Drives the Best Retention?
Answer:
The Subscription Plans drive the best retention for Rapido.
Why It Is Chosen:
- Subscription plans provide predictable costs for frequent riders like Power Users and Core Users, making it easier for them to commit to using Rapido regularly.
- These plans directly address pain points such as fluctuating fares and high costs for gig workers and daily commuters.
Why Others Are Not Chosen:
- Scheduled Rides: Useful for Core Users but less relevant for Power Users who need flexibility rather than pre-planned trips.
- Safety Features: While important for Casual Users and Tier-2 Loyalists, safety alone does not drive high-frequency usage or long-term retention.
- No Surge Pricing: A valuable feature across all segments but insufficient on its own to ensure loyalty without additional cost-saving benefits like subscriptions.
Summary of Microscopic View:
- Best ICP for Retention: Power User - Gig Worker (ICP1), due to high-frequency usage and alignment with features like subscriptions and route optimization.
- Best Acquisition Channel for Retention: Gig Worker Referrals, as they bring in users with aligned needs who naturally stick with the product.
- Best Sub-Feature for Retention: Subscription Plans, as they provide cost predictability and directly cater to frequent riders' needs.
By focusing on these key drivers, Rapido can enhance user retention and maximize engagement across its most valuable segments.
Understanding churn for Rapido user
What is Churn?
In simple terms, a user who used to do an action A, but does not do that action anymore.
Lets explain Churn adding a fun to it:
Imagine you’re texting someone you really like… You go on a great first date (first ride), everything seems perfect, and then—POOF! They stop replying. No calls, no texts, just vanished into the abyss. That, my friend, is churn—but for your app!
In Rapido’s case: Churn: When Users Ghost Your App!
- User downloads the app ---> “This looks cool!”
- They take their first ride ---> “Wow, this is fast & cheap!”
- They never open the app again --->“Eh, I’ll just use my old transport.”
Now, your job is to keep them interested, just like in dating!
- Give them a reason to come back (discounts, rewards).
- Remind them you exist (notifications, FOMO offers).
- Make them feel special (personalized deals, VIP perks).
Because if you don’t? They’ll ghost you… forever.
1) Who Are Churned Users of Rapido?
- Primary Churned Users:
- ICP3 (Casual Users - Students): These users are the most likely to churn due to sporadic usage patterns and limited dependency on the platform.
- ICP4 (Tier-2 Casual Users): While they show slightly better retention, they may churn if local alternatives or public transport options improve.
- Secondary Churned Users:
- ICP2 (Core Users - Urban Professionals): Some churn may occur if competitors offer better pricing or availability during peak hours.
- Unlikely to Churn:
- ICP1 (Power Users - Gig Workers): These users are deeply integrated into Rapido’s ecosystem and churn only under extreme circumstances like service unavailability or better competitor offerings.
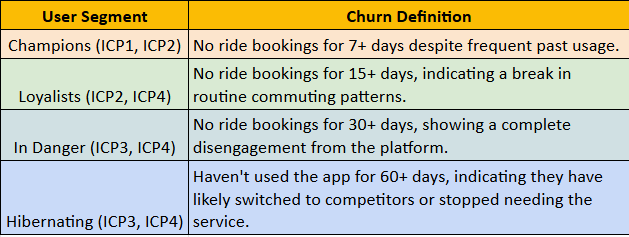
2)What can be churn definition by user segment of Rapido?
3) What Are the Top Reasons Your Users Churn?
Voluntary Churn
These are cases where users actively decide to stop using Rapido due to dissatisfaction or external factors:
- Pricing Issues:
- Competitor apps offering better discounts or promotions.
- Perceived high fares for short rides compared to alternatives.
- Service Availability:
- Lack of drivers during peak hours or in remote areas.
- Delays in driver arrival leading to frustration.
- User Experience:
- App glitches or poor navigation.
- Lack of trust due to driver cancellations or ghosting.
- Competition:
- Switching to Ola/Uber due to better coverage or features.
- Seasonal Usage:
- Students and casual users may stop using Rapido during vacations or semester breaks.
Involuntary Churn
These are cases where users churn due to factors outside their control:
- Payment Failures: Issues with payment gateways leading to frustration.
- Lost Habit Formation: Early users failing to develop a habit of using Rapido regularly.
- Personal Circumstances: Relocation to areas where Rapido is unavailable.
- Device Changes: Users switching phones and not reinstalling the app.
Summary of who is Churn user and top Reasons of Churn
- Primary Churned Users: Casual Users (Students) and Tier-2 Casual Users due to sporadic usage and limited dependency on the platform.
- Churn Definitions by Segment: Vary from 7+ days of inactivity for Champions to 60+ days for Hibernating users.
- Top Reasons for Churn: Pricing issues, service availability, app experience, competition (voluntary), and payment failures or lost habits (involuntary).
To reduce churn, Rapido should focus on improving early engagement, addressing pricing concerns, and enhancing service availability during peak hours.
4) Negative actions that signal Churn
These actions can indicate when a user is at risk of churning:
- Low Net Promoter Score (NPS): Indicates dissatisfaction with the service.
- Low Customer Satisfaction Score (CSAT): Reflects poor experiences with drivers, app performance, or pricing.
- Support Tickets: Frequent complaints about issues like cancellations, driver behavior, or app glitches.
- Unsubscribe Flow: Attempting to delete their account or remove stored payment methods.
- Reduced Engagement: Less frequent ride bookings over time.
- Avoiding Key Features: Not using subscriptions, saved locations, or scheduled rides.
Also they can track user transition between segments.
Lets see how below-
When do user transition between segments?
- Power user---> Core user
- Reduction in daily ride frequency due to fewer work trips or finding alternative transport options.
- Stops using subscription plans.
- Core user ---> Casual user
- Shift from daily commutes to occasional rides due to remote work trends or lifestyle changes.
- Stops engaging with advanced features like auto-booking.
- Casual user --->Churn
- No rides booked for over 30 days due to lack of habit formation or dissatisfaction with service.
Summary of Negative action that is described above.
- Negative signals like low NPS/CSAT scores, reduced engagement, and support tickets help identify churn risks early.
- Addressing these issues through improved onboarding, competitive pricing, and consistent service can reduce churn and retain more users across all segments.
Campaign 1: "Your Ride Stats – You’re a Star Captain!"
Voluntary Churn Reason: Perceived Lack of Value
Segment: Power Users (Gig Workers) transitioning to Core Users.
Goal: Reinforce the value of Rapido in their daily routine.
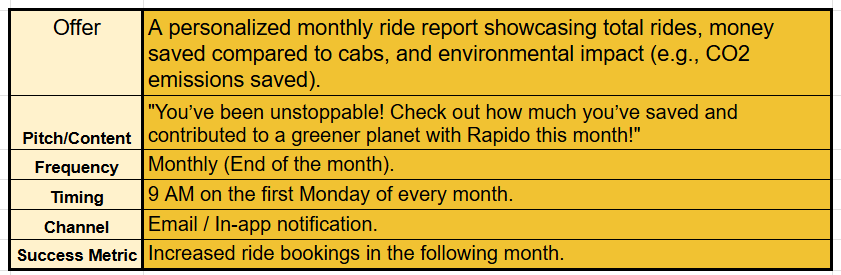
Campaign 1: Why It Will Work:
Gamifying their ride stats makes users feel valued and reinforces their reliance on Rapido for cost-saving and eco-friendly commuting.
Campaign 2: "Come Back and Ride On Us!"
Voluntary Churn Reason: Loss of Interest
Segment: Core Users transitioning to Casual Users.
Goal: Reactivate users with a free ride incentive.
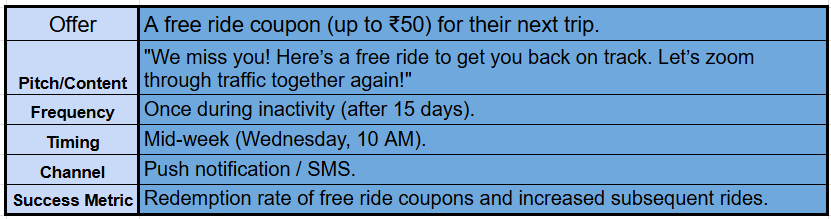
Campaign 2: Why It Will Work:
A free ride lowers the barrier for re-engagement, enticing users to try the platform again and potentially reignite their habit.
Campaign 3: "Tier-2 Hustlers’ Club"
Voluntary Churn Reason: Limited Alternatives
Segment: Tier-2 Casual Users at risk of churn.
Goal: Build loyalty among Tier-2 users by offering exclusive perks.
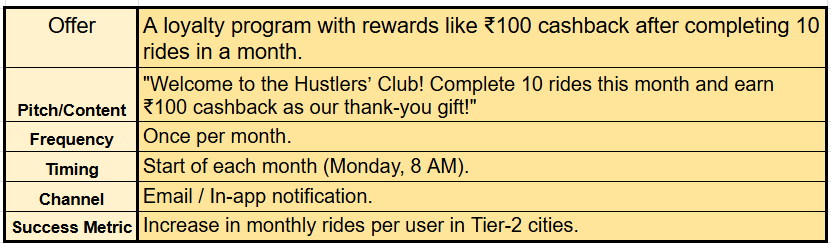
Campaign 3:Why It Will Work:
Tier-2 users value affordability, so cashback rewards will encourage them to stay loyal while increasing revenue.
Campaign 4: "Rainy Day Rides – Stay Dry on Us!"
Involuntary Churn Reason: Seasonal Usage
Segment: Casual Users (Students) who avoid riding during bad weather.
Goal: Encourage users to book rides during monsoons or extreme weather conditions.
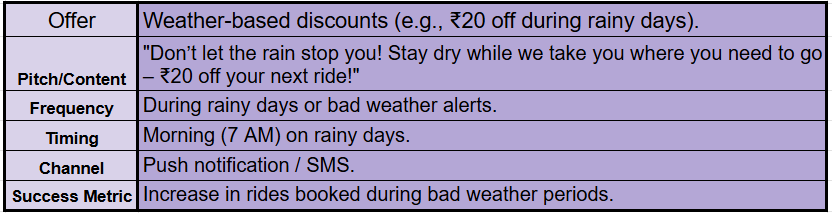
Campaign 4:Why It Will Work:
Weather-based discounts address specific pain points, making users more likely to book rides despite external factors.
Campaign 5: "Rapido Streak Challenge"
Voluntary Churn Reason: Lack of Habit Formation
Segment: All user segments at risk of churn (Power, Core, Casual).
Goal: Gamify engagement by rewarding consistent usage over a week or month.
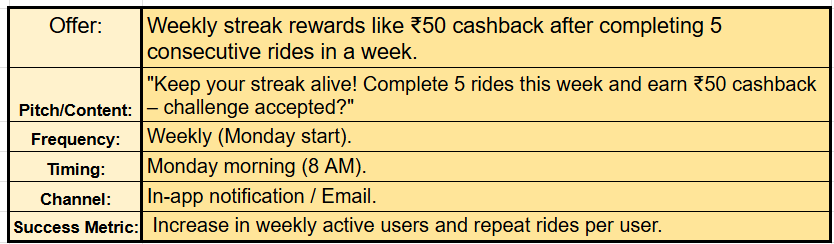
Campaign 5:Why It Will Work:
Gamification motivates users to form habits while driving consistent engagement and revenue.
Campaign 6: "Refer & Earn – Double Rewards This Week!"
Voluntary Churn Reason: Competition
Segment: Power Users and Core Users likely to refer peers for incentives.
Goal: Drive acquisition through referrals while retaining existing users.
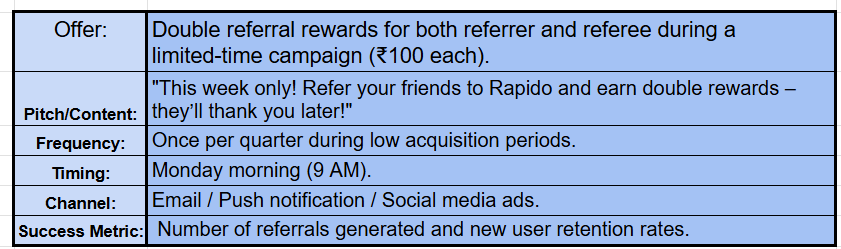
Campaign 6: Why It Will Work:
Double rewards create urgency while leveraging word-of-mouth marketing from loyal users.
Campaign #7: "Rapido Plus – Your Subscription Awaits!"
Voluntary Churn Reason: Pricing Concerns
Segment: Power Users and Core Users looking for cost-effective options.
Goal: Promote subscription plans for frequent riders.
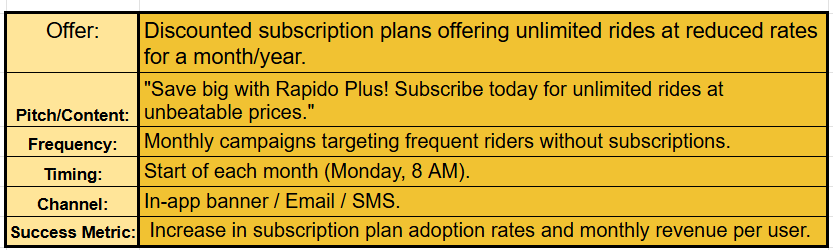
Campaign 7:Why It Will Work:
Subscriptions provide predictable savings for frequent riders while boosting long-term retention.
Summary:
These campaigns combine fun elements like gamification, personalized offers, and seasonal discounts with revenue-driven strategies like subscriptions and referrals, ensuring both user engagement and business growth for Rapido
Brand focused courses
Great brands aren't built on clicks. They're built on trust. Craft narratives that resonate, campaigns that stand out, and brands that last.


All courses
Master every lever of growth — from acquisition to retention, data to events. Pick a course, go deep, and apply it to your business right away.


Courses
Built by Leaders From Amazon, CRED, Zepto, Hindustan Unilever, Flipkart, paytm & more


Crack a new job or a promotion with ELEVATE
Designed for mid-senior & leadership roles across growth, product, marketing, strategy & business


Learning Resources
Browse 500+ case studies, articles & resources the learning resources that you won't find on the internet.

Patience—you’re about to be impressed.